

Know where the agency stands, without building a spreadsheet
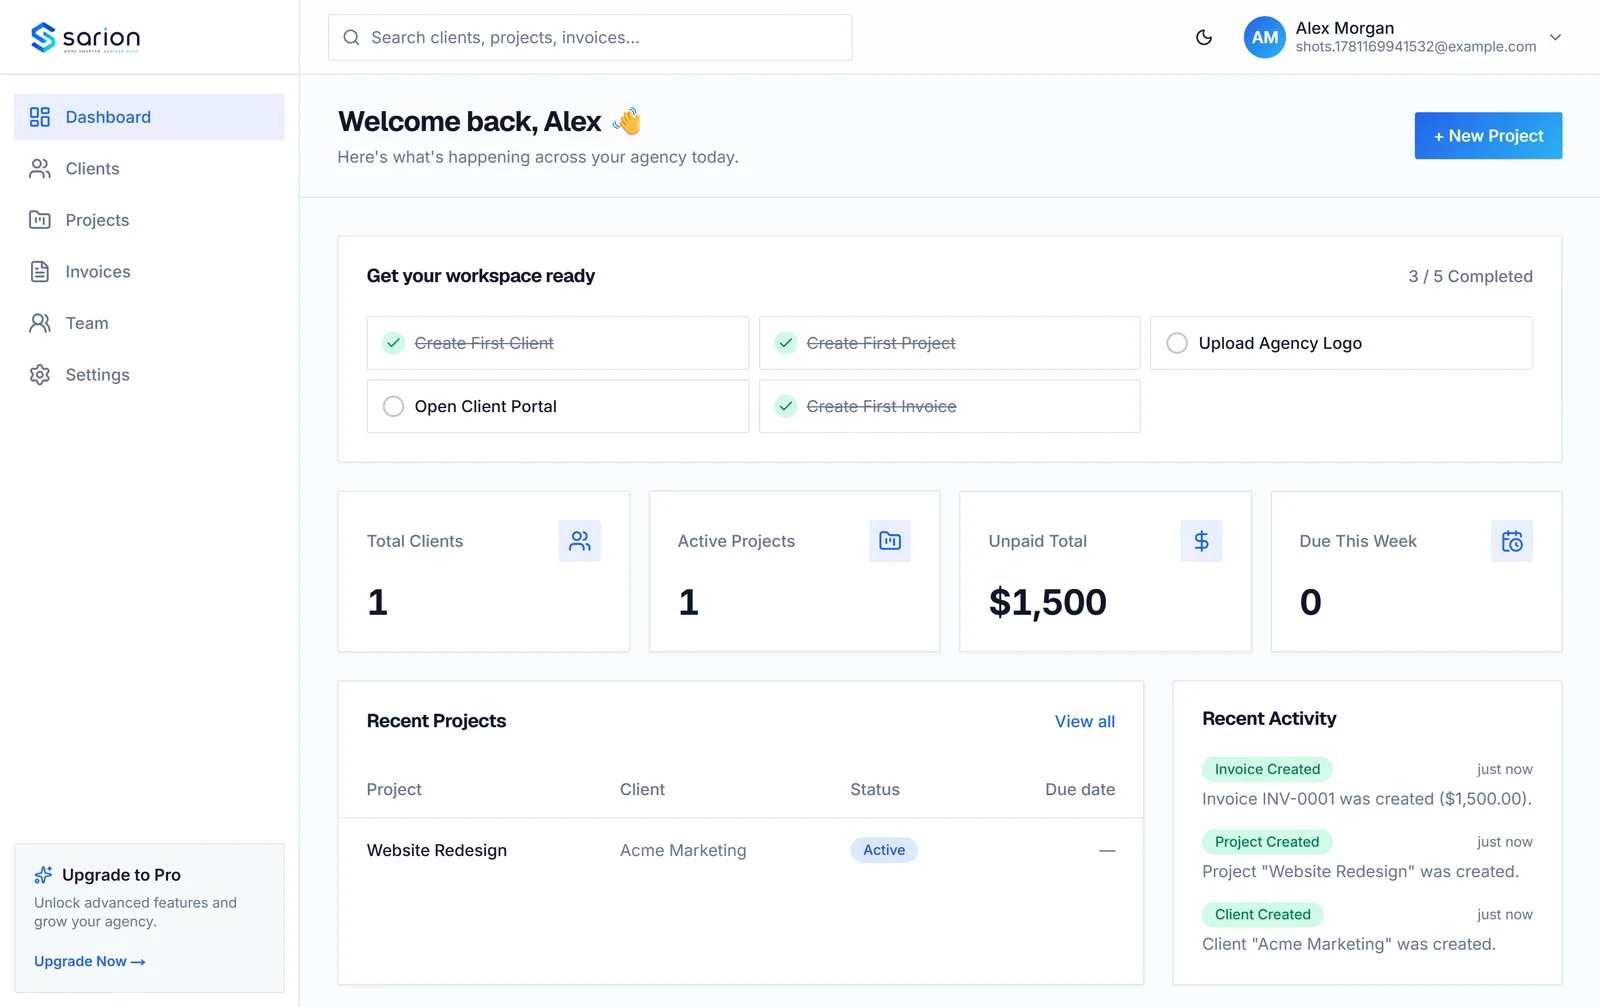
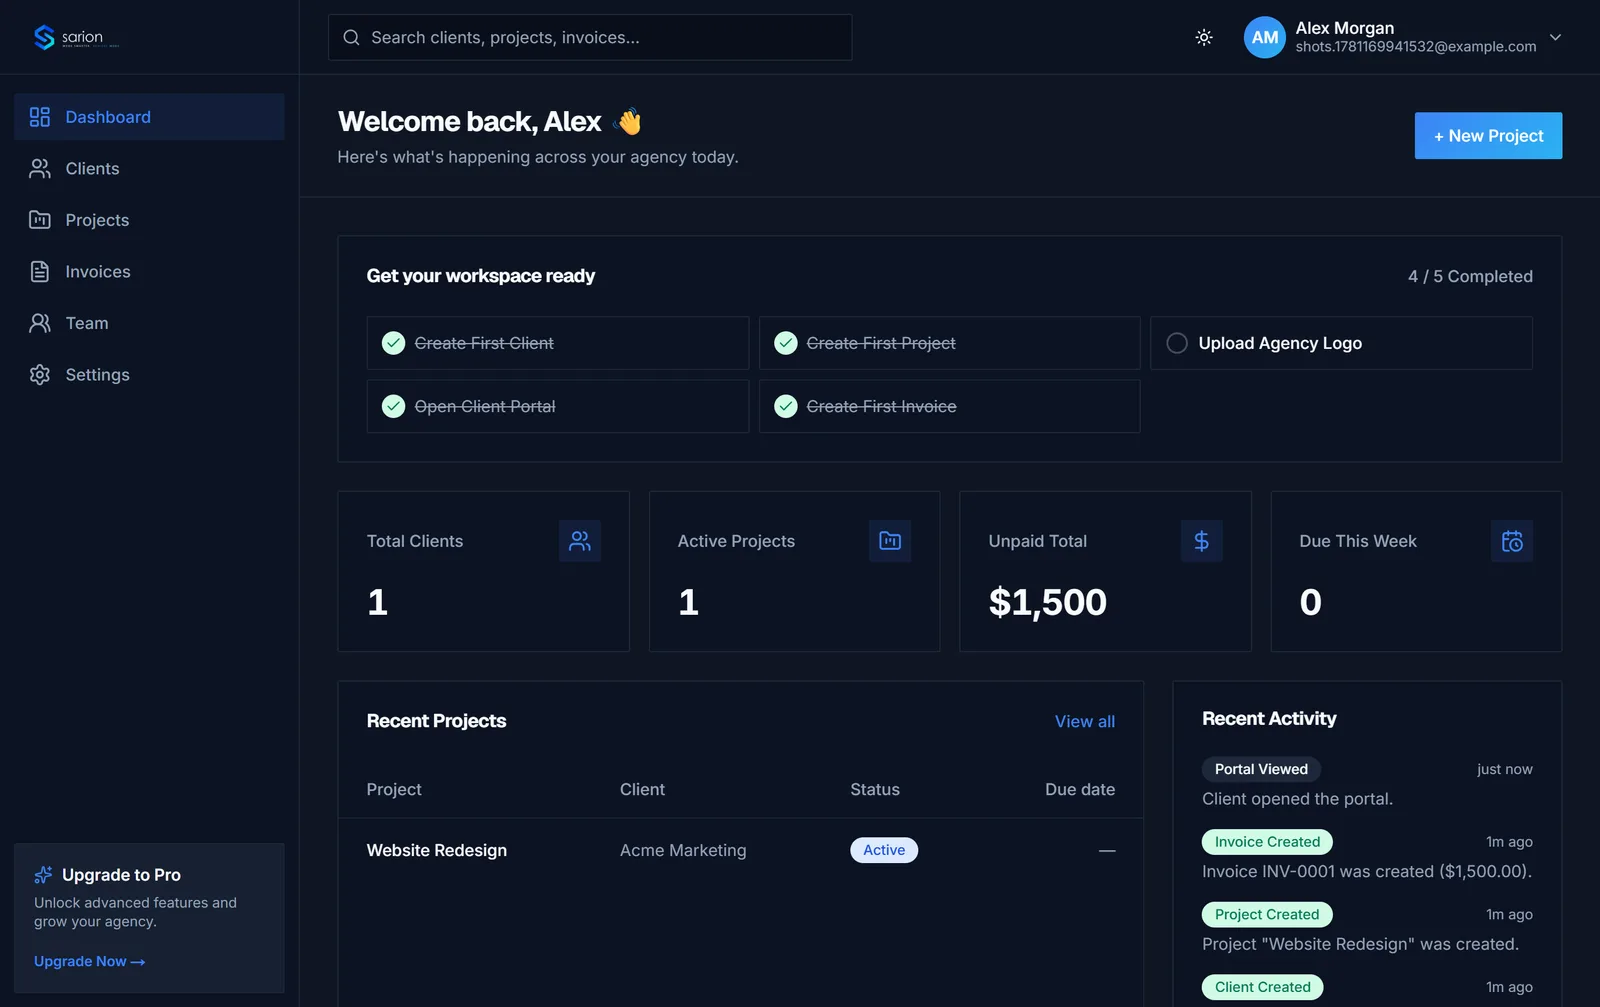
Revenue trends, invoice aging, project status, and top clients — computed from the same client, project, and invoice records your team already works in.
No exports to babysit, no separate BI tool to maintain. Sarion turns the client data already in your workspace into revenue trends, invoice aging, project status, and a single business health score you can check in seconds.
See the money, not just the workload
Owners open the dashboard on a Monday morning and see six months of revenue trend alongside the paid, unpaid, and overdue split — no reconciling a bank statement against a spreadsheet to know where the agency stands.
- 6-month revenue trend
- Paid / unpaid / overdue breakdown
- Outstanding aging buckets (current, 1-30, 31-60, 61-90, 90+ days)
Cash flow problems show up on the dashboard, not as a surprise at month-end.
Know what's moving and who's paying
Project leads check status counts — planned, active, completed, on hold, delayed — before standup, while account leads glance at top clients ranked by actual paid revenue to see who the agency's work really depends on.
- Project status breakdown
- Delayed project count
- Top clients by revenue, with outstanding balance and project count
Delivery and revenue priorities line up instead of living in separate spreadsheets.
See the dashboard →One number for how the agency is doing
Instead of checking overdue invoices, delayed projects, and client activity separately, founders glance at a single health score that already rolled all three together — then drill in only when the number moves.
- Business health score
- Finance snapshot
- Team utilization
You know something's off before it turns into a client escalation.
See plans →Questions about Sarion's reporting
Can I export reports?
Reporting in Sarion is built for viewing and tracking — revenue, invoice status, and project data update live as your team works, so you're always looking at the current numbers instead of a snapshot that goes stale the moment you export it.
How is the business health score calculated?
It rolls up the signals that actually predict trouble: overdue invoices, delayed projects, and how recently your clients have had activity on their account. One number instead of five dashboards to cross-reference before you know if the agency is in good shape.
Do I need a separate BI tool for this?
No. Revenue trends, invoice aging, project status, and your top clients by revenue are already built from the same client, project, and invoice records you work in every day — there's no data warehouse or spreadsheet export step to maintain.
Where do the top clients and revenue numbers come from?
Directly from your invoices and projects — paid invoice totals per client, outstanding balances, and project counts. Nothing is estimated or modeled; it's the same data underlying your /clients and /finance views, just summarized.